Tracing configuration
Overview
During the automation of processes, there are situations where the execution needs to be traced or debugged. Bizagi offers the possibility to trace errors in the Processes Work flows (for their control and diagnosis) so that you can validate if the business rules, validations, interfaces invocations, or even the Process needs to be tuned up.
How does tracing work?
Traces monitor the project at various levels, such as the process and its activities, the business rules, validations and business policies, interface invocations, and forms controls.
Bizagi offers tracing capabilities at different levels:
- Environment level
- Server level
Traces at the environment level
To enable and configure tracing, you may enable each object/component separately and set a filter so that the generated logs include levels of detail (e.g. warnings and errors, or errors only).
The steps to accomplish this are:
- Acknowledging which traces to enable (from the different objects and components).
- Defining their trace detail.
Note: In addition to the trace detail, it is also recommended to view the events and log of your server. These logs will help you to find error details whenever you are debugging your processes.
1. Acknowledging which traces to enable
Enabling the traces for the automation stages of the project is done from Bizagi Studio or the Management Console through the Tracing option:
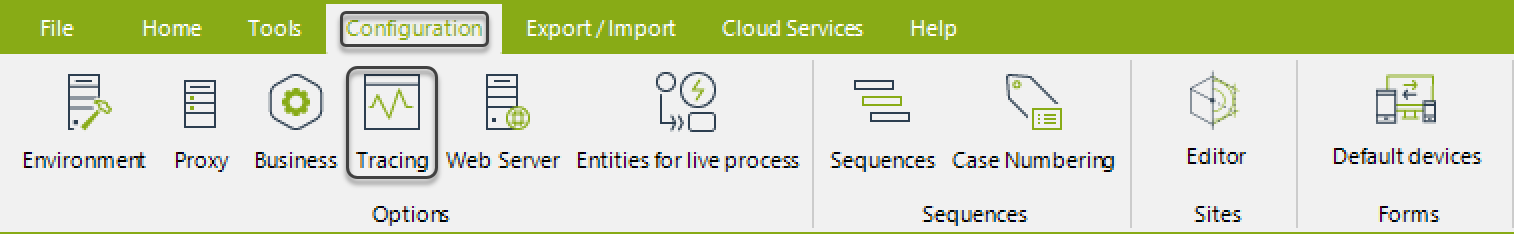
To learn how to activate traces in your Automation Services environments, click here.
Note: Even though the trace feature is available for all environments, it should be used mainly for debugging purposes (e.g traces for expressions) and is mainly intended for the Development environment. It is strongly recommended to exploit this feature while testing the Processes so that in the Production environment this is only required if strictly necessary.
Once you click on the Tracing configuration window, you will see the objects and components available:
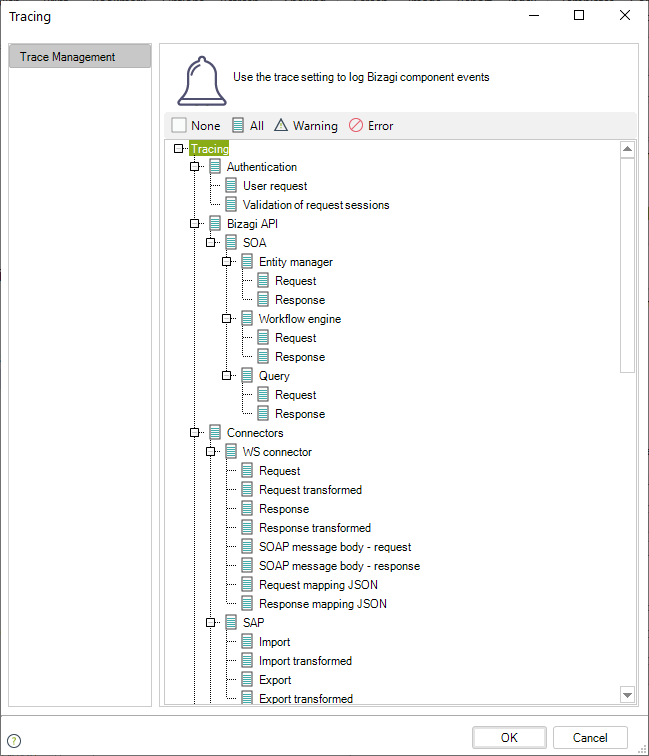
It is important to acknowledge and plan which traces you wish to enable.
The following table describes the possibilities regarding these objects and components:
| ELEMENT | DESCRIPTION |
|---|---|
| Authentication | Logs when a user is being authenticated in the System (User Request) and when the System is automatically validating a Request Session (Validation of Request Session). |
| Bizagi API / SOA / Entity manager | Logs when an EntityManagerSOA web method is invoked. This option traces requests and responses. |
| Bizagi API / SOA / Workflow Engine | Logs when a WorkflowEngineSOA web method is invoked. This option traces requests and responses. |
| Bizagi API / SOA / Query | Logs when a QuerySOA web method is invoked. This option traces requests and responses. |
| Connectors / WS Connector | Logs when an external interface is invoked. This option traces requests and responses. |
| Connectors / SAP | Logs when an SAP BAPI is invoked. This option traces inputs and outputs parameters. |
| Connectors / External Connectors | Logs when a Connector Action is executed. This option traces Inputs, Outputs, data transformation and connector logic of the Connector. |
| Connectors / SAP Cloud Platform | Logs when the SAP Cloud Connector is invoked. This option traces input and output parameters. |
| Connectors / Connectors.FormsRecogizer | Logs when the Forms Recognizer connector is executed. This option traces Inputs, Outputs, and data transformation of the Connector. |
| Data replication | Logs when a replication schema has been started and ended. |
| ECM | Logs the integration with ECM systems. |
| Entity manager | Logs the execution of EntityManager activity (database access). |
| LDAP | Logs the execution of the scheduled synchronization of LDAP users into Bizagi. |
| Render (Control) | Logs the construction of a form in the Work Portal (rendering forms and their controls). |
| RPA | Logs when a RPA bot is invoked. This option traces input and output parameters. |
| Rules and expressions | Logs the execution and evaluation of business rules and policies. |
| Scheduler | Logs the execution of the Scheduler's jobs. |
| Workflow | Logs when a transaction begins, when the information is saved in the database, when a case is created and the execution of each shape. |
2. Defining the trace detail
To decide what alerts exactly to trace (the detail level), in the selected Tracing option in the Standard Menu, click on the trace type and define its detail level (Error, Warning, All).
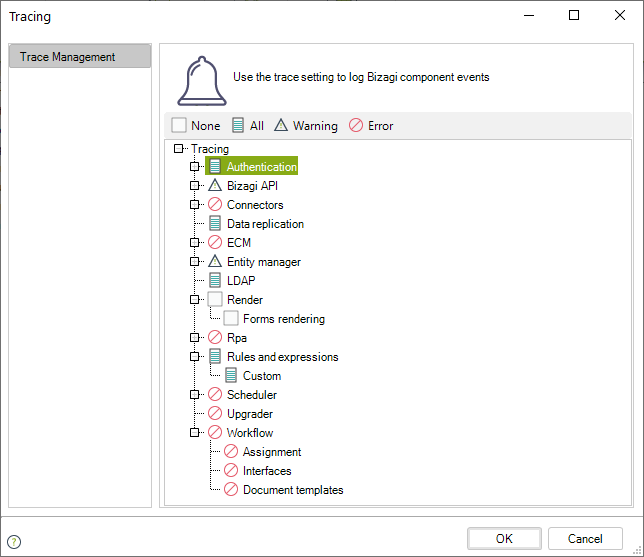
By default, None is selected (an empty box is shown) for all trace objects/components.
- When Error is selected, the trace file will only log errors.
- When Warning is selected, the trace file will log both warnings and errors.
- When All is selected, the trace file will log: warnings, errors, and step-by-step information about the executed commands.
Notice that you may select each trace type (and its subtypes) and select a trace detail configuration for each.
After saving changes on these items, it may be required to restart your Bizagi server's service (e.g. IISreset command in IIS).
Traces location
Once enabled, traces will be saved as plain text files on the Bizagi Server.
They will be located under a different path, according to the specific web and application server used as the Bizagi Server.
| ELEMENTS | LOCATION |
|---|---|
| Authentication | C:\Bizagi\Projects\ [project_name]\Trace\ |
| Data Replication | C:\Bizagi\Projects\ [project_name]\Temporary\BizagApi\SOA |
| Entity manager | C:\Bizagi\Projects\ [project_name]\Temporary\BizagApi\SOA |
| LDAP | C:\Bizagi\Projects\ [project_name]\Temporary\BizagApi\SOA |
| Render (Control) | C:\Bizagi\Projects\ [project_name]\Temporary\BizagApi\SOA |
Traces at the server level
When Bizagi Studio or automation runs on an on-premises server, Bizagi registers some events from the different components of a Bizagi project, such as:
- Work Portal (web application)
- Scheduler
Server traces are located in the Bizagi folder installation. Usually located at: C:\Bizagi\Trace
Work Portal (web application) trace
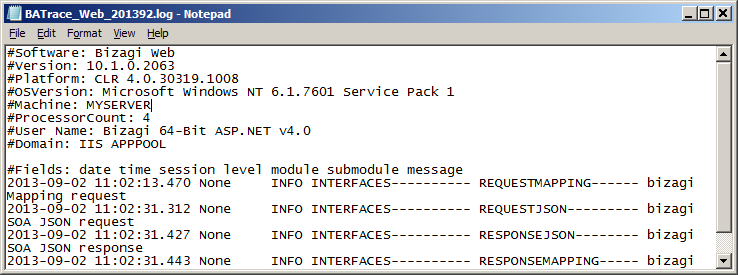
The Work Portal trace logs the detail executions at the Web application.
These logs are found at the .\Trace folder as split logs named BATrace_Web_[date].log.
The following example illustrates the logged information in these files:
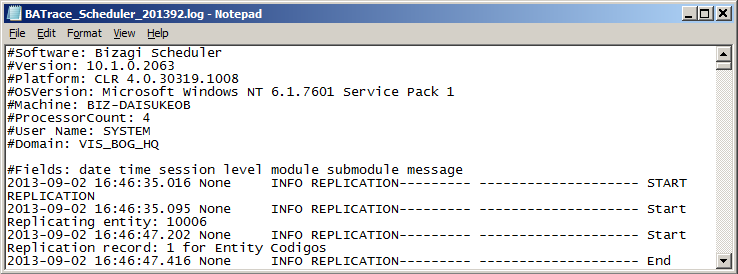
Scheduler trace
The Scheduler trace logs the detail executions carried out by this thread.
These logs are found at the .\Trace folder as split logs named BATrace_Scheduler_[date].log.
The following example illustrates the logged information in these files:
Authentication traces
Whenever you integrate a SAML-compliant Identity provider for Bizagi to delegate authentication to it, logged detail you may rely on, include:
- USERREQUEST: Provides a message applicable to the information sent from Bizagi to the Identity provider (regarding the user's request to log in).
- VALIDATESESSIONREQUEST: Provides a message applicable to the response received by Bizagi, as issued by the Identity provider.
The following image illustrates an example of an authentication tracing file:
